
How to trade AUD/USD for beginners
Reading time: 15 minutes
The Australian dollar versus the US dollar – quoted as AUD/USD – accounts for approximately 5% of global turnover in the foreign exchange (Forex [FX]) market and is the 4th most widely traded currency pair, according to the Bank for International Settlements (BIS). Individually, the BIS also states that the AUD represents 6% of global turnover, while the USD commands the lion's share at nearly 90%. The point of this is to show that AUD/USD is one of the more approachable pairs to start with.
This currency pair trades around the clock, five days a week, and is made up of large dealer networks with no central exchange, unlike stocks. With FX, therefore, trading takes place across different time zones, beginning with the Asian session. Trading then transitions to open in Europe, then London, and finally the US session. This is repeated daily.
The AUD/USD responds well to major market drivers while providing sufficient liquidity and volatility. High liquidity means the market has plenty of willing buyers and sellers, leading to tighter spreads – the gap between the bid (the price buyers are willing to pay) and the offer (the price sellers are willing to accept) – and, ultimately, lower trading costs.
Personally, I always advise new FX traders to focus on a single currency pair. This gives you the opportunity to understand its flow, central bank biases, and economic data. Once you are comfortable with one pair, you can add more pairs to your watchlist.
AUD/USD: Understanding the basics
As with any currency pair in the Forex market, the first currency quoted in an exchange rate is the ‘base’ currency; the second currency listed is commonly called the ‘quote’ or ‘term’ currency. In the case of AUD/USD, the AUD is the base currency and always represents 1 unit, while the USD is the quote currency and shows how much the AUD is worth in USD.
It is important to understand that you trade the base currency, but the numbers you see on the chart's Y-axis are the price of the quote currency (USD). For example, if the AUD/USD is trading at US$0.6605, it means that buying 1 AUD would cost US$0.66 (rounded).
If your analysis points to an appreciation of the AUD against the USD, you would enter the market ‘long’. Conversely, an analysis suggesting a weaker AUD against the USD would have you entering the market ‘short’. Going long and short are common terms among traders, but their origin is unclear.
AUD/USD drivers: What’s behind its price action?
Central banks:
Without question, the primary drivers in the FX market are central banks. For the AUD/USD, that is the Reserve Bank of Australia (RBA) and the US Federal Reserve (Fed). This is because capital flows toward higher-yielding currencies. And when the gap between the RBA’s cash rate and the Fed’s target rate narrows or widens, it can trigger price moves in the currency pair.
However, it is not just the cash rate and the target rate levels that are important – this is largely backwards-looking; it is the expectations of the future rate path that are key: interest rate differentials. Experienced FX traders do not think so much about ‘today’; they care about where the market believes these rates will be in the future. While many market professionals utilise the OIS (Overnight Index Swap) curve to access these expectations, retail traders generally do not have access to this pricing. Fortunately, we can replace these with short-term interest rate futures, or ‘STIRS’, on TradingView’s platform.
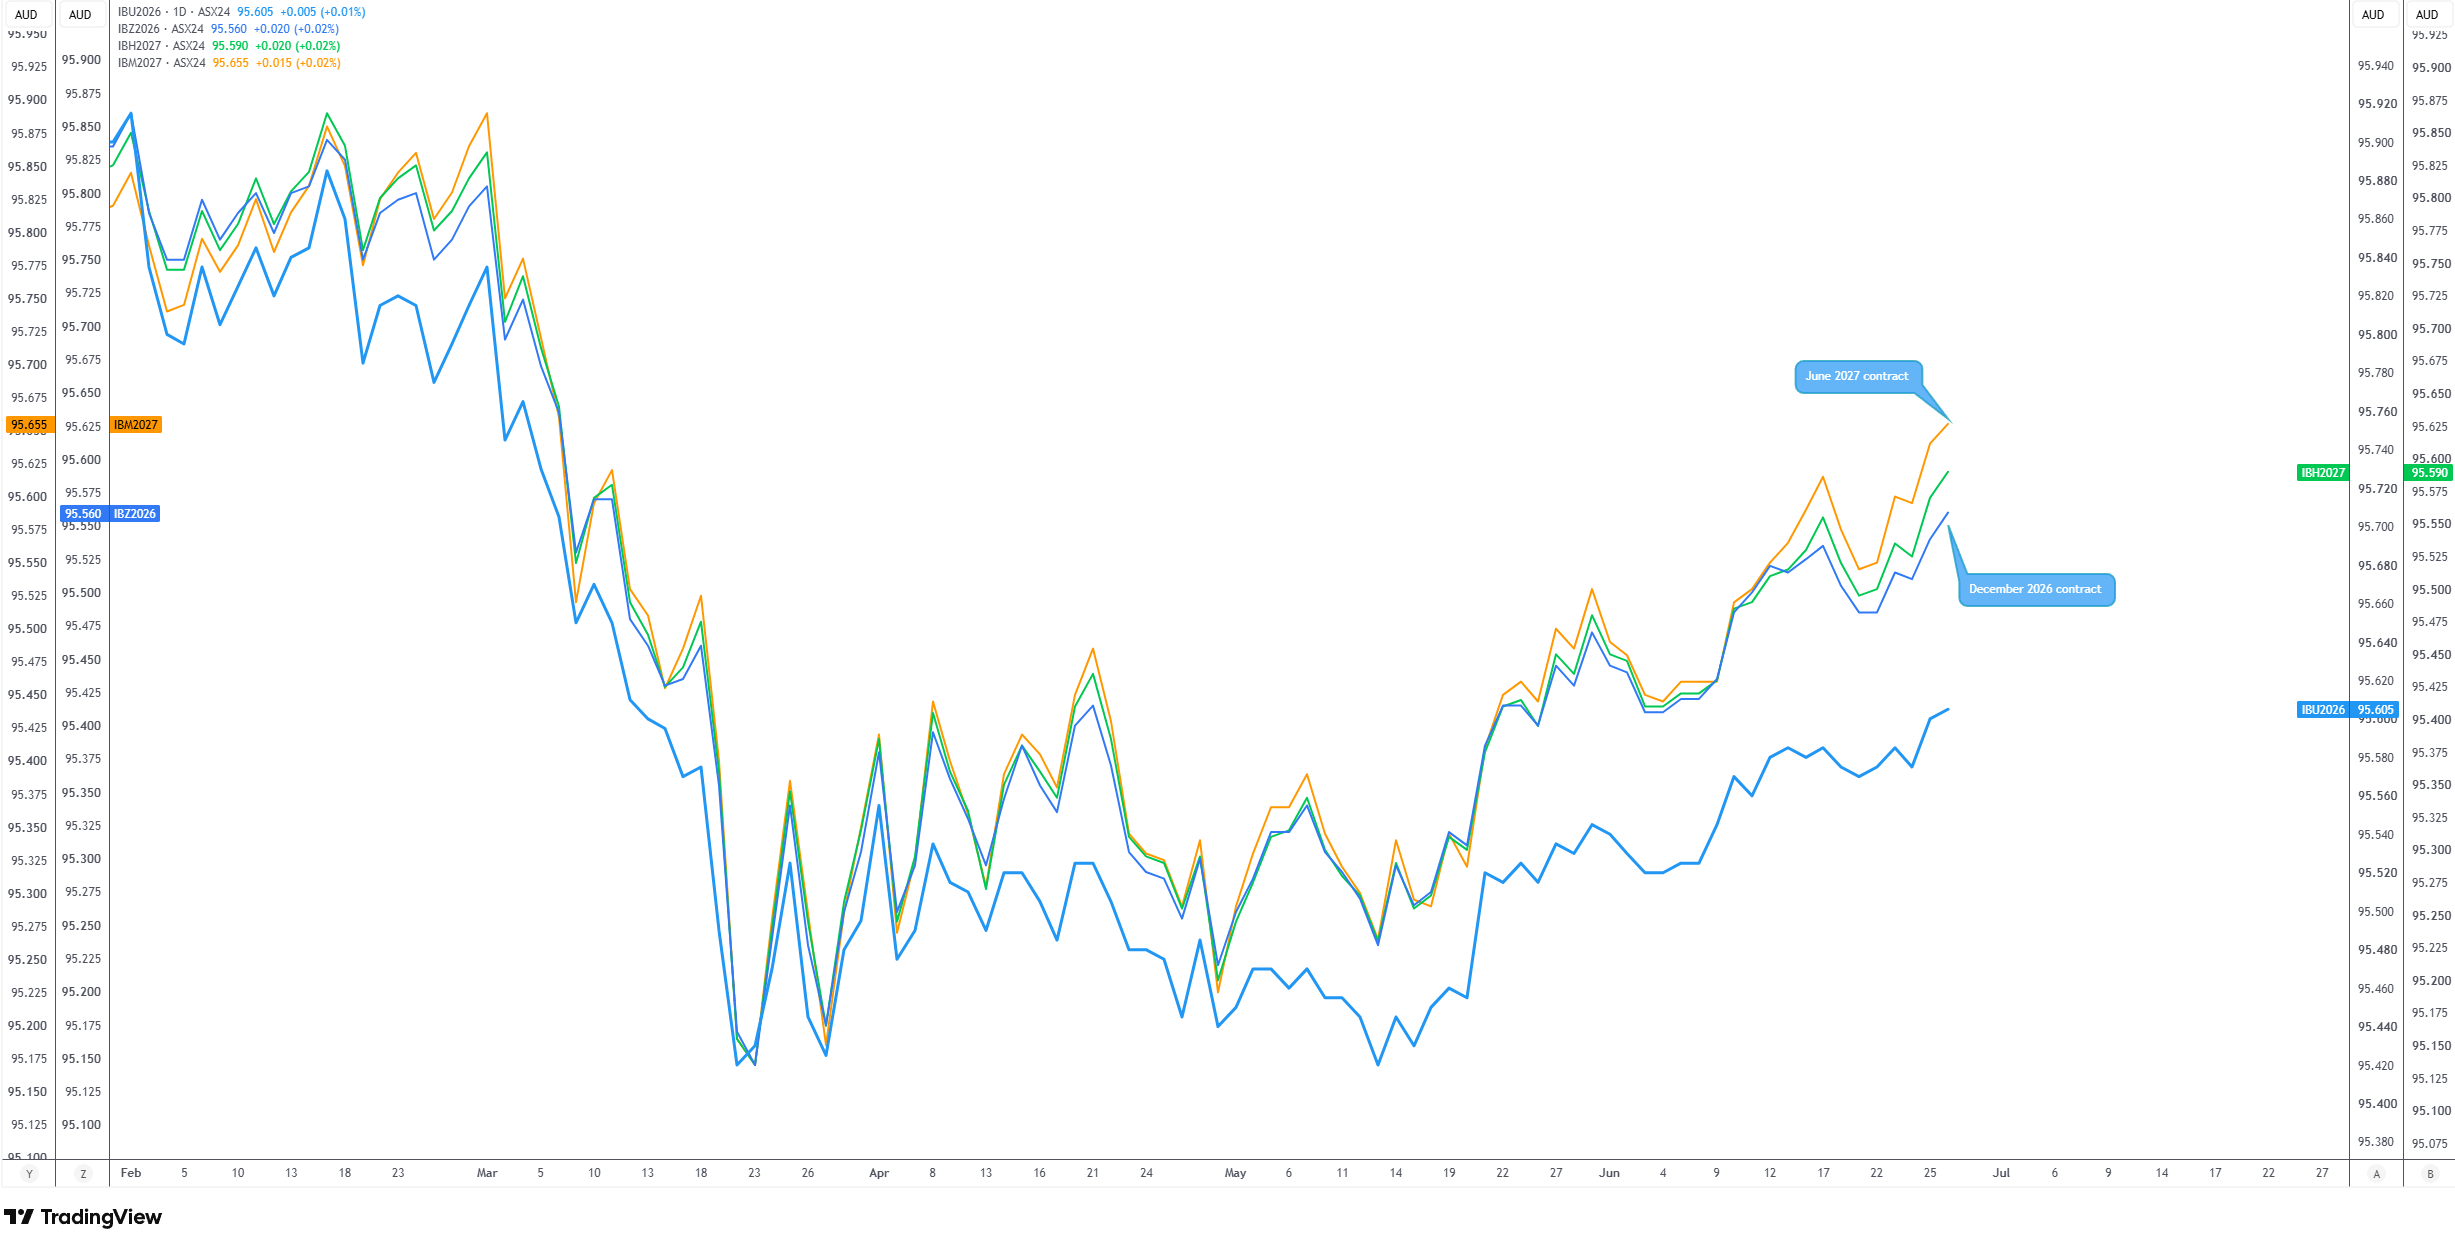
I have created an RBA-implied rate curve chart below using ASX cash rate futures. I do want to note that the following charts were created at the time of writing (July 2026), so you will need to create your own rate curve (using the same tickers) to access up-to-date values. You will see that by using the standard conversion formula (100 - futures price = implied yield), you get the expected interest rate for the expiration date. With the RBA’s cash rate at 4.35%, futures markets indicate the RBA may still hike again this year, with 9 basis points (bps) priced in by year-end, implying a 36% chance (9 / 25). The 2026 December contract shows 4.44% (100 - 95.56), and the June 2027 contract shows 4.34% (100 - 95.66), meaning that while there is a small chance of a hike this year, and if it does happen, it could be reversed next year. I know it may seem complex, but it is worth the time to understand this.
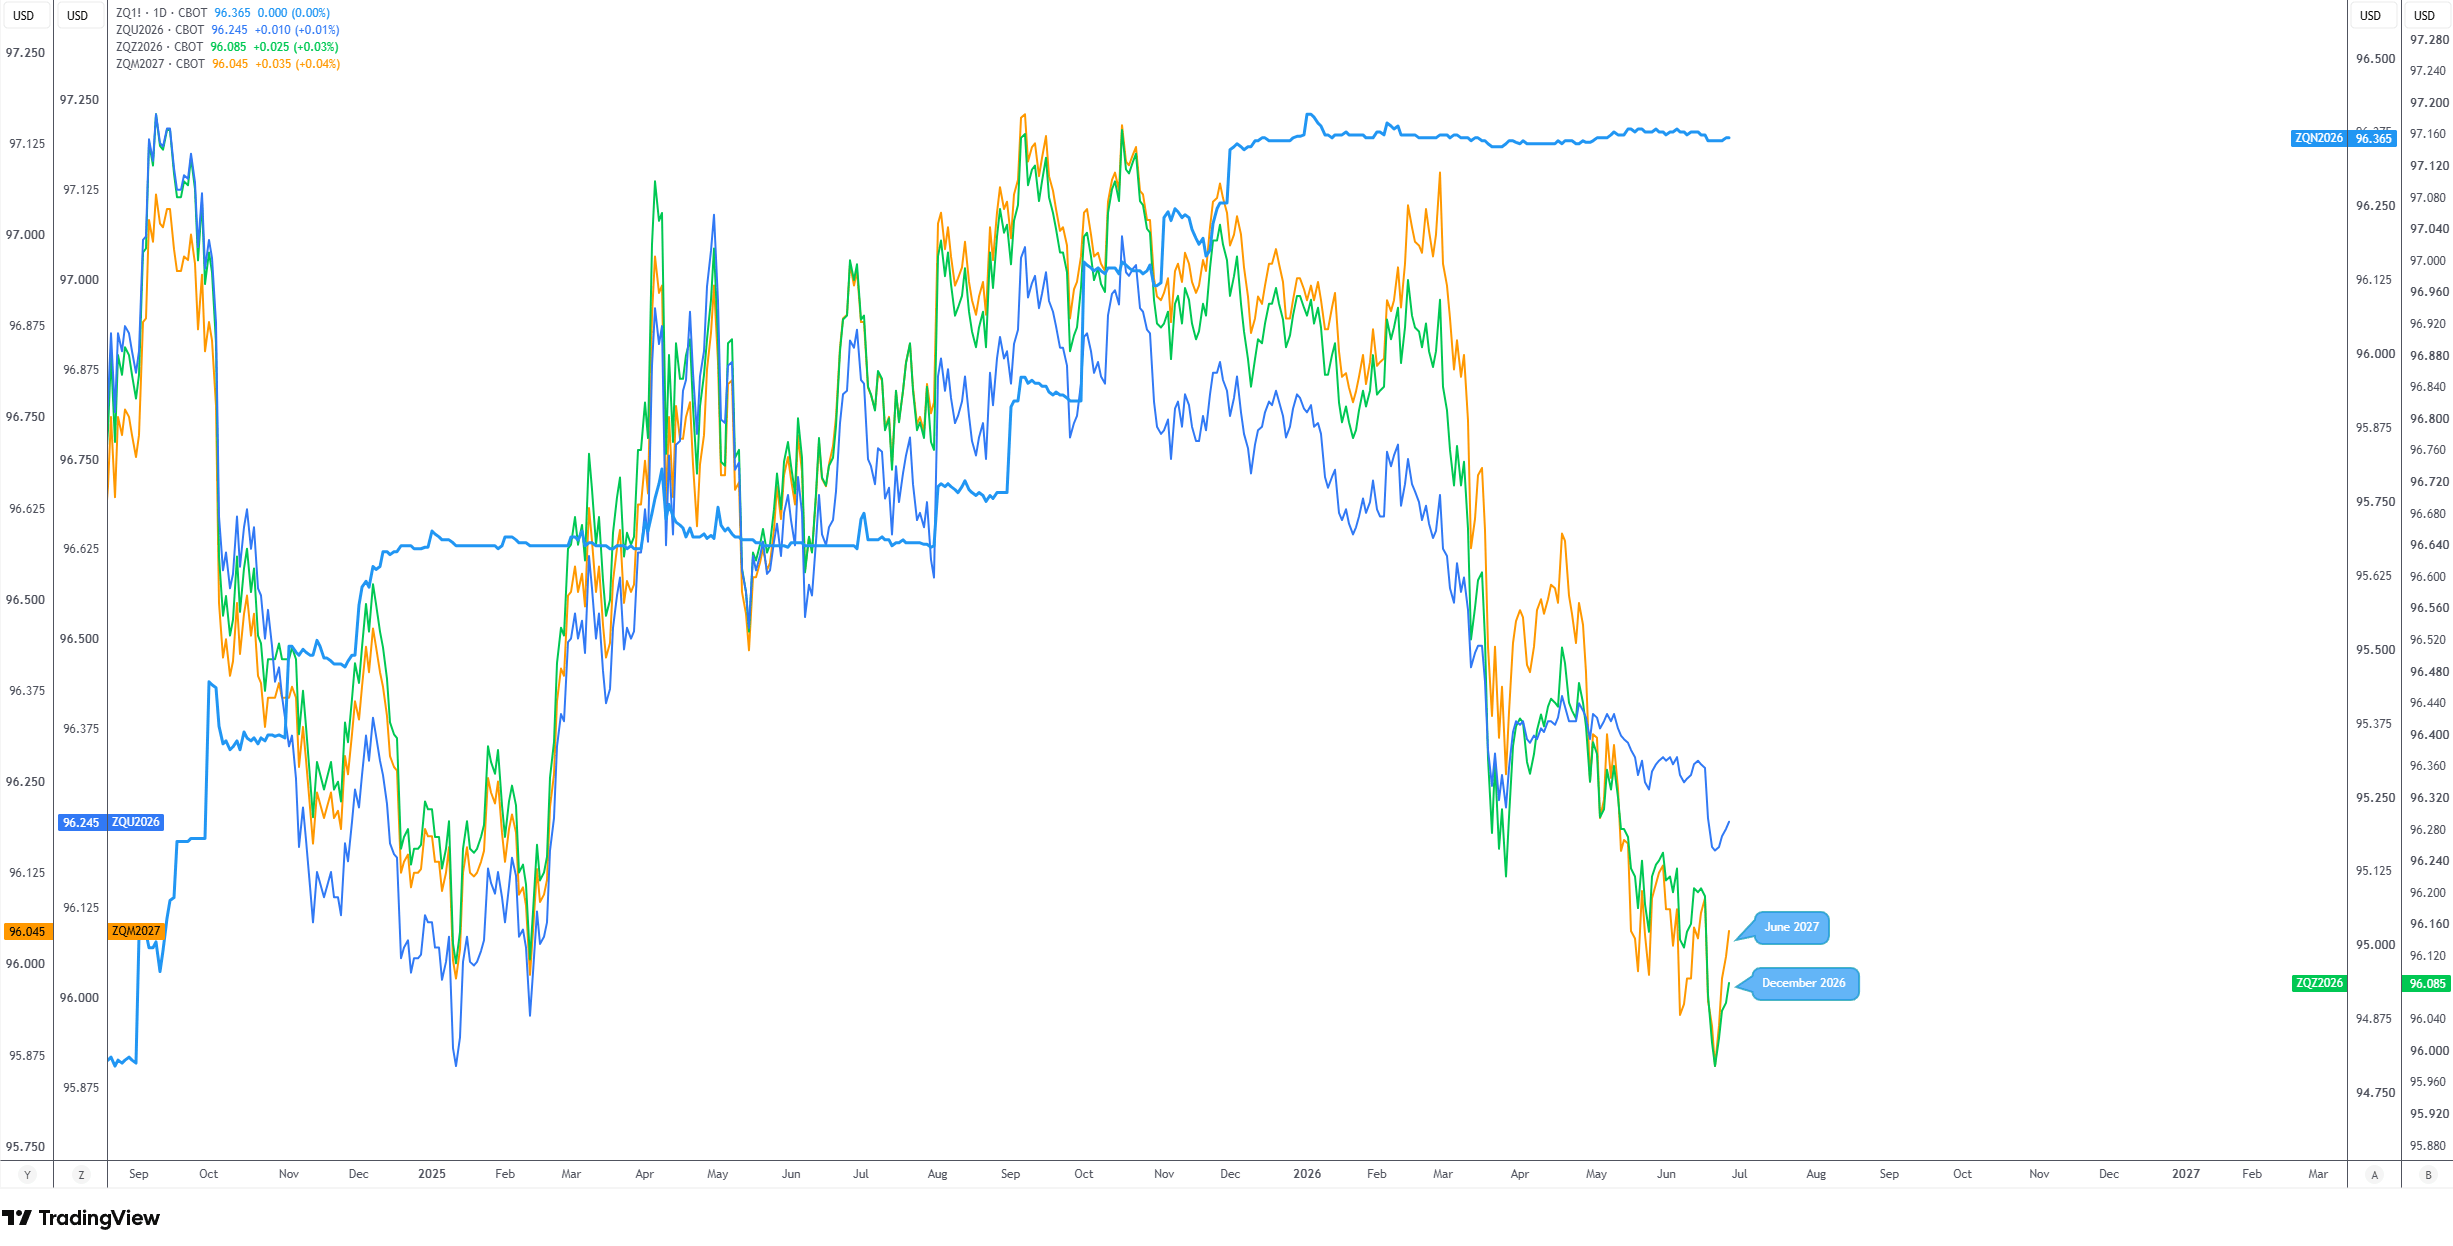
Below is the same chart for the US: a Fed-implied rate curve chart. This layout tracks CBOT 30-Day Fed Funds futures (ZQ), which directly price the market's expectation of the Effective Federal Funds Rate (or ‘EFFR’). As shown in the chart, the December 2026 contract is trading at 96.085, showing 29 bps of policy tightening by year-end (100 - 96.085 = 3.915%). So, not only does the market believe one rate hike is on the table, but it also believes there is a small chance of another hike before the year is out – about a 16% chance (4 / 25). The June 2027 contract (100 - 96.045 = 3.955%) shows 33 bps of tightening. This means the market expects one rate hike over the next 12 months and prices in a 32% chance of another.
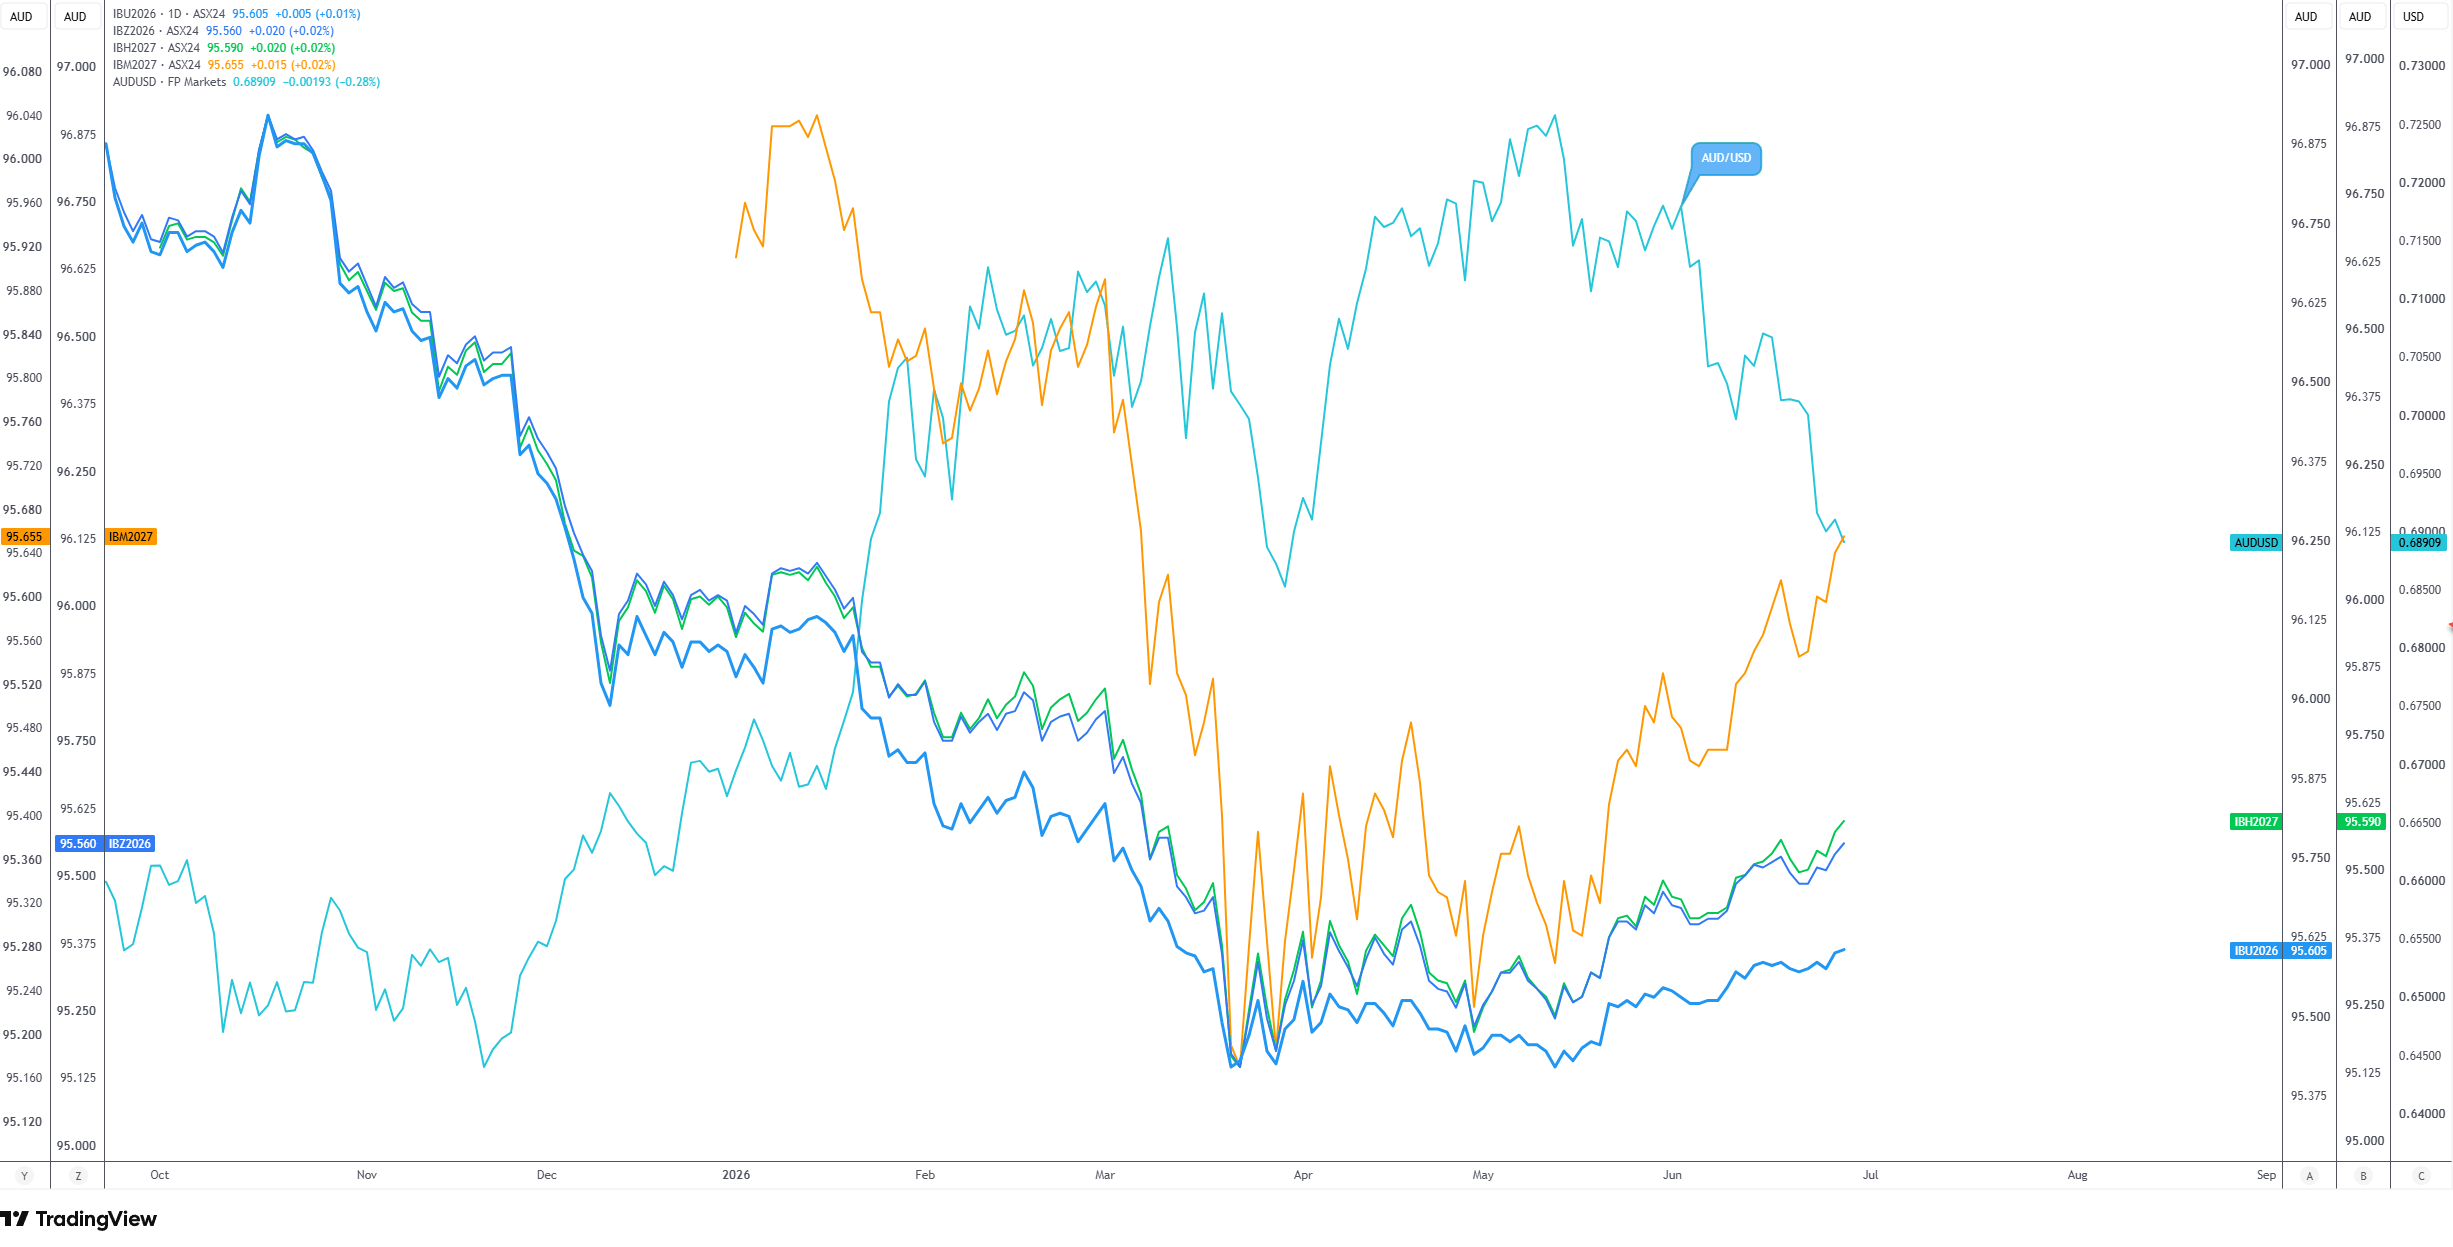
So, given that markets expect the Fed to raise its target rate over the next year and the RBA to likely remain on hold, this has been one of the drivers weighing on the AUD/USD pair. The chart below shows the same RBA-implied rate curve as above, with the AUD/USD overlaid. You can see that while the ASX cash rate futures prices rose (pricing out an RBA hike), Fed funds futures prices dropped (pricing in a Fed hike), and the AUD/USD fell.
Economic data:
Economic data is another key driver of FX markets. For me, the central bank’s biases and rate expectations help me understand which way a pair may trend, and economic data offers opportunities to take trades that align with (or counter) these biases.
Importantly, you do not need to be an economist to trade this way. Of course, it would help, but it is not necessary. The next question I am often asked is which data you should watch and trade. The simple answer is that you should be at least watching the big three indicators: inflation (CPI, for example), jobs (US Non-farm payrolls [NFP]), and growth (Gross Domestic Product [GDP]). But what to monitor specifically should be determined by the central bank’s forward guidance: what they are watching will determine the rate path, so you should be monitoring this, too.
For example, if the RBA and Fed are concerned about inflation and have said that rate increases could occur as a result, then inflation data and anything directly related to price pressures should be closely monitored. A higher-than-expected inflation release from Australia could, therefore, strengthen the AUD/USD, as traders interpret it as the RBA leaning more towards hiking rates.
Market sentiment:
Finally, I keep a close eye on market sentiment, primarily data from the CFTC (Commodity Futures Trading Commission). The Team and I put together a three-part series on this here. This helps tell me where currencies are overstretched. While some may disagree, I found that overextended currencies can offer unwind opportunities. Suppose the AUD has been heavily bought over the last month, and the USD has sold off. If US inflation data came in stronger than expected – assuming we stick with the example I outlined in the previous paragraphs – this release could prompt traders to unwind some of their short (long) USD (AUD) exposure.
Building a beginner strategy
If there is one piece of advice I wish I had listened to most when I started my career, it would be to take it slow. While it is imperative that you learn about trading psychology and risk management – this is beyond the scope of this article, but is addressed here and here – creating a trading strategy requires you to take a few unique steps.
To help illustrate this, I am going to walk you through an example of how to generate a trading idea. As a reminder, this is written with data I have on hand at the time of writing, and if you are reading this a week on, things might have changed. However, the idea here is to leave you with a framework that you can build on.
We know the RBA is expected to remain on hold, and the Fed is potentially hiking rates. These are the current expectations. They can change, but this is what we have to work with right now.
In the Fed’s latest Summary of Economic Projections, the central bank revised its 2026 PCE inflation target higher to 3.6%, with 9 of the 18 members actually voting to increase the target rate this year. This was a marked change from the March projections and was viewed as a hawkish pivot.
Compare this with the RBA’s latest meeting, which showed the Board holding the cash rate steady to monitor the effects of its recent rate hikes – the central bank increased rates for three consecutive meetings following the pause. The RBA Governor explicitly stated that the central bank cannot rule out rate hikes as inflation remains high. However, unlike the Fed’s aggressive upward revision of its inflation target and the clear internal push for near-term hikes, the RBA's language focused heavily on data dependence.
This tells you there is a clear focus on inflation right now, and with Australian inflation data for May 2026 actually slowing (despite economists expecting a rise) and US inflation coming in higher – PCE inflation hit its highest level since 2023 – this creates an opportunity to short AUD/USD.
From a technical standpoint, you can keep things very simple here, locating support, and when/if this barrier is breached, you can enter a sell order and attempt to trail the position using something as basic as a moving average. Alternatively, you can enter following a data release. For example, if US jobs data beats expectations, you can use the initial knee-jerk rally in the US Dollar to sell AUD/USD at a premium, placing your stop loss above the most recent structural high.
So, what we have done here is created a strategy that first finds the ‘why’ using macro analysis – why should a currency pair move in a certain direction – and then we create the ‘when’ using technical analysis.
How can I trade the AUD/USD?
While there are several ways you can gain exposure to the pair – such as futures and options – you will find that many retail traders opt to trade via CFDs (Contracts for Differences). With FP Markets, CFD traders can access a wide selection of FX currency pairs and trade stocks, indices, commodities, bonds, cryptocurrencies, and Exchange-Traded Funds.
Trading AUD/USD via a CFD works in much the same way as the long and short examples I gave earlier. If your analysis points to AUD strength, you go long; if you believe the USD will outperform, you go short – and unlike some other instruments, CFDs make it just as straightforward to generate a return from a falling price as a rising one.
While it is beyond the scope of a single article to cover everything, if you are new to trading, I would strongly suggest starting with a demo account first. This allows you to become familiar with the trading platform, backtest strategies and build confidence before transitioning to a live trading account. This also allows you to familiarise yourself with common trading concepts, such as lot sizes, leverage and margin, and position sizing.
Written by FP Markets Chief Market Analyst, Aaron Hill
Frequently asked questions (FAQs)
The AUD/USD exchange rate is influenced by several factors, including interest rate expectations, economic data, commodity prices, central bank decisions, and overall market sentiment. Changes in these factors can cause the value of the Australian dollar relative to the US dollar to rise or fall.
A good starting point is to understand the fundamental factors driving the currency pair, such as interest rate expectations and economic data. Traders can then use technical analysis to identify potential entry and exit points, while applying sound risk management to protect their capital.
AUD/USD is widely traded, highly liquid, and typically offers competitive spreads, making it an accessible currency pair for new traders. It is also influenced by well-known economic events and central bank decisions, giving beginners plenty of opportunities to learn how fundamental and technical analysis work together.